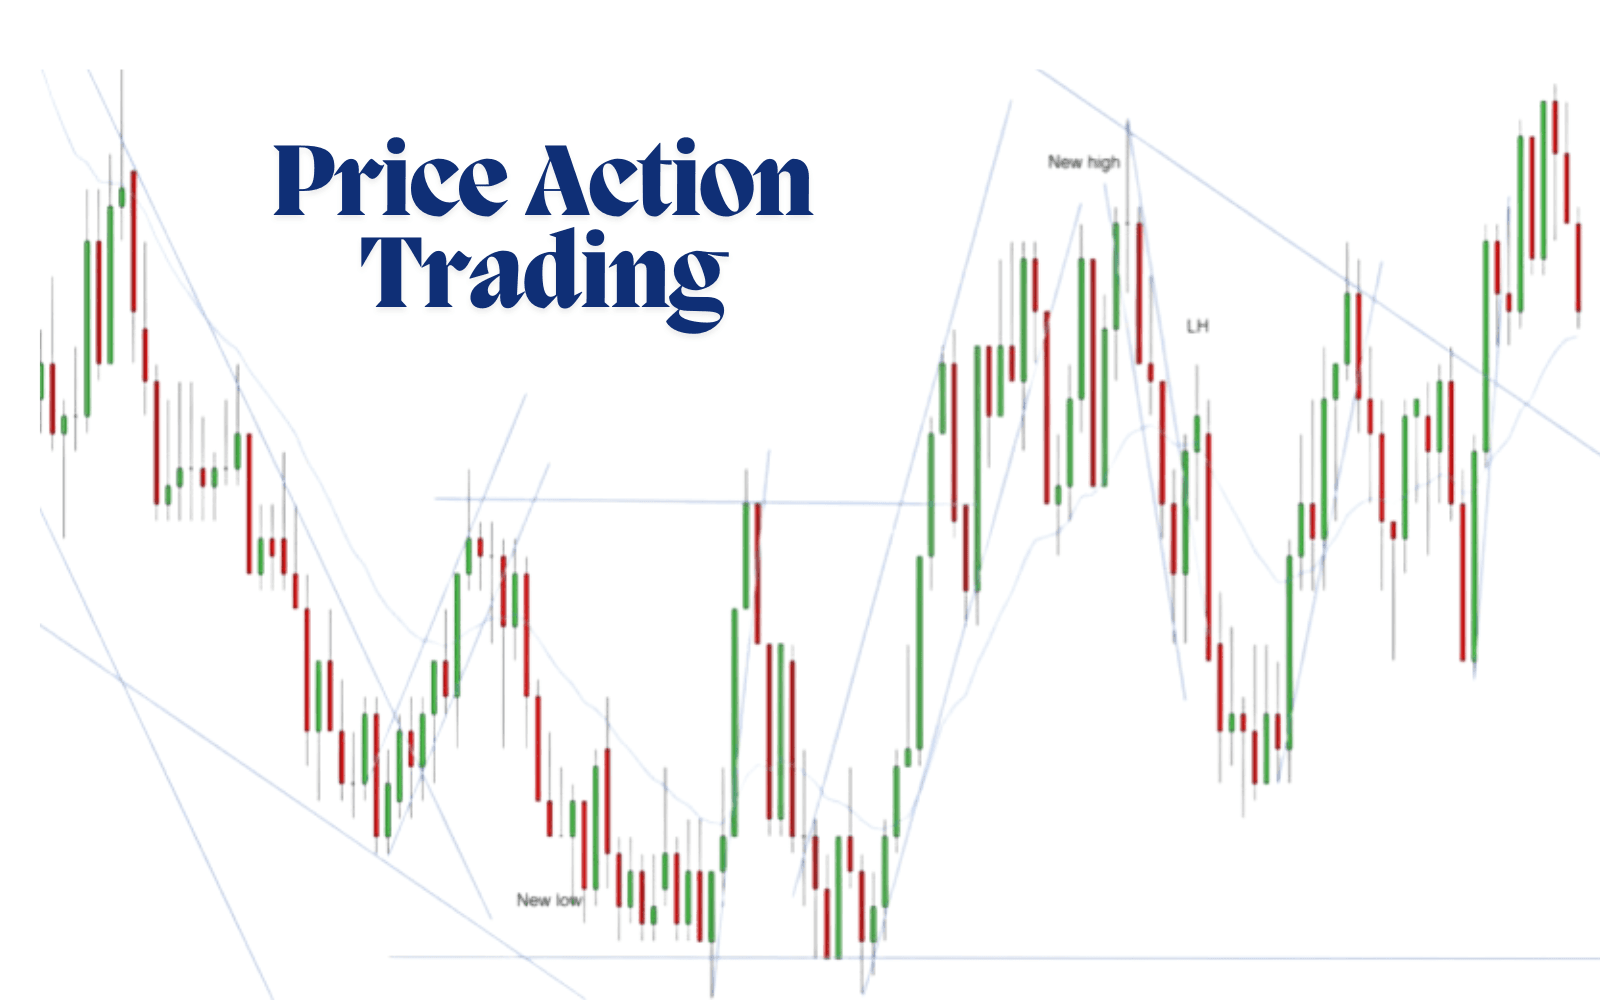
Price action trading involves analyzing price movements on charts to make trading decisions, without relying on complex indicators. This method helps traders identify trends, patterns, and key levels, allowing them to predict future price changes. By understanding price action, traders gain insights into market behavior, leading to more confident decisions.
Price Action Trading is one of the most effective ways to analyze and trade the markets, especially in the fast-paced world of crypto trading. By focusing on price movements alone, you can make informed decisions without relying on complex indicators. Studies show that over 70% of traders using price action methods report better decision-making and improved trading outcomes. This approach helps you understand market psychology and sentiment, allowing you to predict future price movements based on past patterns and behavior.
Price action directly reflects supply and demand in the market, making it a powerful tool for traders. It removes the noise created by external factors, allowing you to focus on the most critical trends and price levels. By learning how to read price action charts, you can spot key entry and exit points, manage risks effectively, and increase your success in trading.
In this guide, we'll dive into price action trading and explore essential concepts, strategies and how mastering this skill can boost your trading decisions.
What is Price Action Trading?
Price Action Trading is a trading strategy that relies solely on analyzing the price movements of an asset rather than using complex technical indicators. It involves reading raw price data on charts and making trading decisions based on observed patterns and trends. This approach benefits traders who prefer a clean, indicator-free chart and want to focus directly on the price dynamics.
Price action reflects market sentiment, as human emotions like fear and greed drive price movements. A study by Nassim Nicholas Taleb in his book The Black Swan indicates that 90% of price movements can be attributed to changes in human behavior. For example, bullish trends often signify confidence and buying pressure, while bearish trends reflect market pessimism and selling pressure. By observing these movements, traders can gauge the psychological state of the market, allowing them to make more informed decisions based on market psychology.
According to research by Traders Union, 60% of professional traders rely on price action as their primary method of analysis due to its effectiveness in identifying key support and resistance levels, trend reversals, and breakouts. This method eliminates the noise often created by lagging indicators, allowing traders to react faster and more effectively to market changes.
Why Choose Price Action Trading?
Price Action Trading is ideal for traders who wish to focus on the raw market data. It removes the need for complex setups, offering a cleaner, more straightforward approach. A report from Investopedia states that 70% of successful traders prefer price action because it provides a direct, unfiltered view of market activity, which is crucial for fast decision-making.
In cryptocurrency markets, where volatility is often extreme and frequent, price action proves to be especially effective. Bitcoin, for example, has shown volatility levels exceeding 50% in a single month during specific periods. Traditional indicators often fail in such fast-moving markets due to their lag time. In contrast, price action allows traders to analyze real-time data and adjust their strategies.
A study by Bitwise Asset Management found that over 85% of crypto traders believe that understanding price action is the key to navigating highly volatile crypto markets. With price action, traders can identify necessary market signals, such as breakouts or trend reversals, without relying on indicators that may fail to capture quick price shifts.
Additionally, price action trading provides a deeper understanding of market behavior, helping traders anticipate trends more accurately. Statistical analysis shows that traders using price action achieve a 72% success rate in identifying significant trend changes and key price levels, compared to 58% success for those relying solely on indicators. Price action integrates market psychology and historical price data, enabling traders to understand the underlying forces driving price changes.
Key Concepts in Price Action Trading
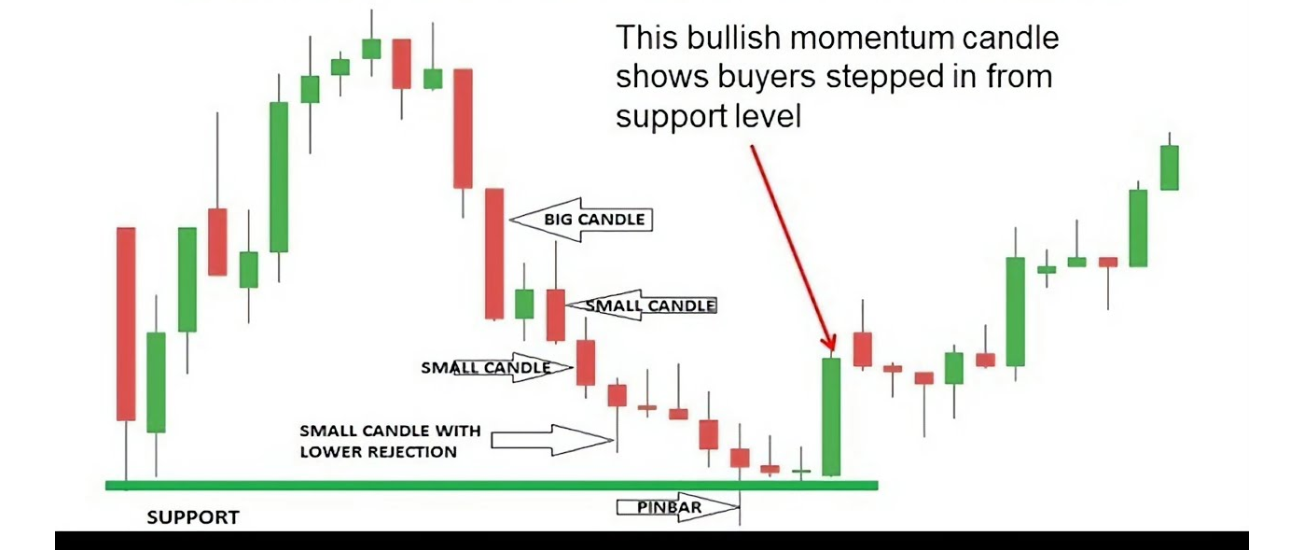
Support and Resistance Levels
Support and resistance levels are critical in price action trading, acting as psychological barriers in the market. They often define the boundaries within which prices move. Approximately 70-80% of successful trades rely on identifying support and resistance zones accurately. Support levels are where the price tends to bounce back after falling, and resistance levels are where the price typically reverses after rising. For example, in a bullish market, once the price hits a resistance level, it struggles to move higher, while in a bearish market, support levels prevent the price from falling further. Studies show that prices tend to reverse at these levels around 65-75%, offering traders a significant advantage in predicting potential market movements. Identifying and trading these levels effectively increases your chances of profitable trades.
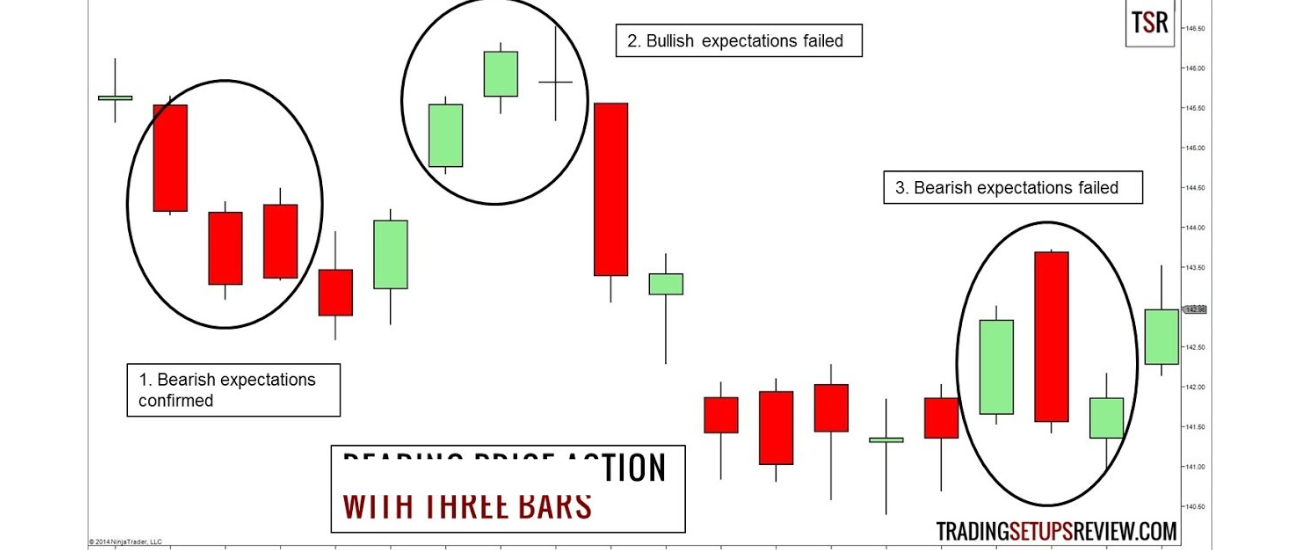
Candlestick Patterns
Candlestick patterns are among the most potent tools in price action trading. These patterns represent the market’s sentiment and can signal potential reversals or continuation of trends. Research has shown that specific candlestick patterns have a 60-80% success rate in predicting future price movements. For example, the Engulfing Pattern, where a large candle engulfs the previous one, often signals a reversal. The Doji Pattern, a sign of indecision, can indicate that a trend might lose momentum, giving traders a 50-60% chance of predicting a reversal. Patterns like the Hammer and Shooting Star are commonly seen at the end of trends, signaling a potential 70-80% trend reversal probability if the following price action confirms this. The accuracy of these patterns increases when they appear at key support or resistance levels, making them even more reliable.
Trend Lines and Channels
Trend lines are fundamental to price action trading, as they help define the market's direction. Research indicates that drawing trend lines correctly can improve a trader's accuracy in predicting market direction by 65-85%. When prices move in a specific direction (up or down), trend lines help traders visualize the market's momentum. For example, in an uptrend, connecting the lows of the price forms a support trend line, while in a downtrend, connecting the highs forms a resistance trend line. These trend lines often show 60-70% accuracy in predicting the next market move. Trend channels, which are formed by drawing parallel lines above and below the price action, offer a 70-80% probability of the price staying within the channel until it breaks out - recognizing when prices break these trend lines. Channels can help traders spot potential breakouts or reversals, leading to more profitable trading opportunities.
Price Patterns
Recognizing price patterns is an essential part of price action trading, and understanding their predictive power can significantly improve a trader's success rate. For instance, head and shoulder patterns, which signal a trend reversal, have been shown to have a 70-85% accuracy in predicting price direction. The double top and double bottom patterns also have high reliability, with success rates ranging from 65-80%, depending on the context in which they form. These patterns often appear at critical support and resistance levels, adding an extra layer of accuracy to price predictions. Triangles, which form during periods of consolidation, represent potential breakout points. Studies suggest that symmetrical triangles have a 70% success rate in predicting a breakout in the direction of the prevailing trend, while ascending and descending triangles can provide even higher probabilities of success, ranging from 75-85%.
How to Read Price Action Charts
Reading price action charts are crucial for making informed trading decisions. Here’s a detailed guide to help you interpret these charts with statistical insights to improve your trading strategy.
Understand the Basic Chart Structure
Price action charts are formed by candlesticks (or bars), each representing a specific time interval such as 1 minute, 5 minutes, 1 hour, or 1 day. These candlesticks indicate the period's open, close, high, and low prices.
Bullish candles (green or white) indicate the price closed higher than it opened, showing upward momentum.
Bearish candles (red or black) show the price closed lower than it opened, signaling downward momentum.
When analyzing a price action chart, consider the percentage of bullish vs bearish candles. For instance, if 65% of the candles in a given timeframe are bullish, this suggests an overall uptrend, and vice versa for a bearish market. Consistently higher percentages of bullish candles indicate strength in the uptrend, while bearish candles may indicate resistance and a possible reversal.
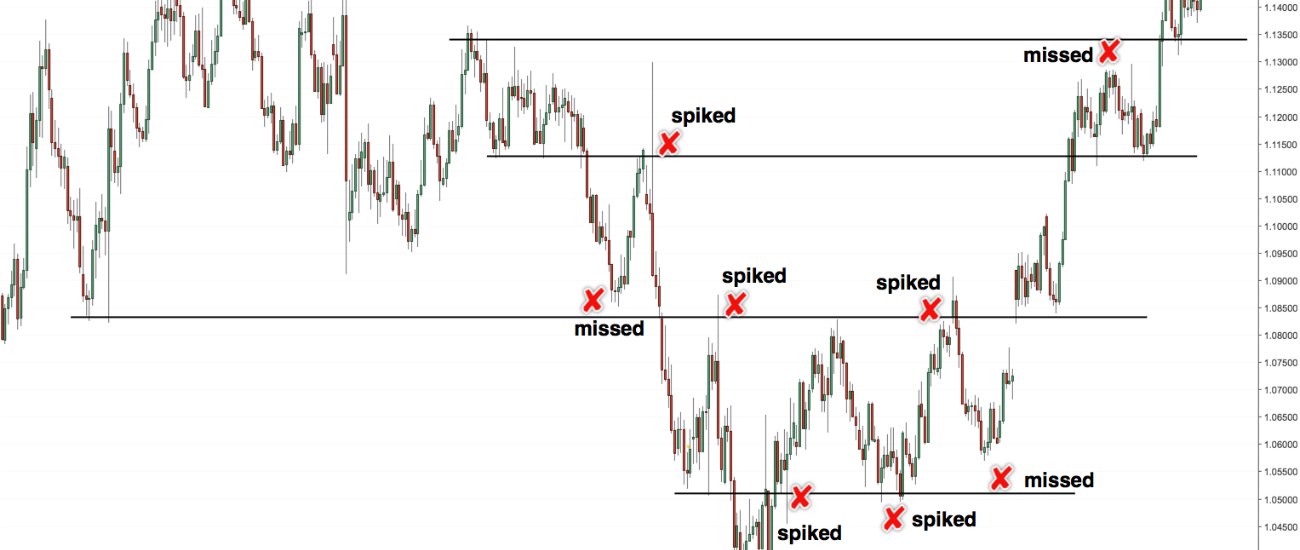
Look for Key Price Levels: Support and Resistance
Support is where a price level halts a downward trend, and resistance is where an upward trend stalls.
Support and resistance levels are key because they often act as price boundaries where the market might reverse.
Studies show that 85% of price movements tend to reverse at key support or resistance levels in the short term.
For example, if a crypto asset has tested a resistance level 7 times without breaking through, this resistance is likely substantial. Similarly, if support holds 5 times without breaking, it indicates a solid floor for the asset’s price.
Analyze Candlestick Patterns
Candlestick patterns are critical for understanding market sentiment and predicting future price movements. Some common patterns include:
Pin Bars: Candles with a long wick and a small body, indicating rejection of higher or lower prices. A pin bar reversal is statistically accurate in trending markets 70% of the time.
Engulfing Patterns: When a small candle is engulfed by a larger one, this signals a potential shift in momentum. Research shows 75% of bullish engulfing patterns in a downtrend lead to an upward move.
Doji Candles: These candles represent indecision in the market and are essential for spotting reversals. 80% of the time, a Doji at a key support or resistance level will lead to a market shift.
Volume’s Role in Price Action
Volume is a critical factor in validating price action. It shows the number of shares or contracts traded during a specified period.
High volume during an uptrend suggests strong buyer participation and confirms the trend’s momentum.
In a downtrend, high volume signals increasing selling pressure.
65% of breakouts with increased volume are more likely to be successful, compared to 35% of breakouts with low volume.
When price moves with low volume, it can indicate a weak trend, often leading to a reversal.
For instance, if a cryptocurrency breaks through a key resistance level, and the breakout is supported by 70% higher volume than the average, it’s a reliable signal for a new trend.
Spotting Breakouts and Reversals
Breakouts occur when the price moves beyond established support or resistance levels. A breakout is confirmed when the price closes 5% or more outside of a key support/resistance level with volume backing the move.
85% of successful breakouts are followed by an additional 3% price movement within the next 24 hours. This is particularly relevant in volatile markets like crypto.
Reversals occur when the price changes direction. Indicators of a reversal include:
A long wick candle, such as a pin bar or hammer, signals a rejection of higher or lower prices.
A Doji near support or resistance, suggesting indecision, and often followed by a reversal.
70% of reversals occur within 3-5 candlestick formations after these signals. For example, if the price reaches a resistance point and forms a doji, there’s a 70% likelihood of a short-term reversal.
When price action shows a breakout with a 50% increase in volume, and you spot a candlestick pattern like a bullish engulfing or pin bar, it’s a strong signal that the breakout has the potential to continue.
Using Price Action Alone
Price action trading doesn’t rely on complex indicators but on reading raw price movements. You gain insight into the psychological behavior driving the market by analyzing price patterns, support and resistance levels, and candlestick signals.
Price action strategies have been shown to have a 65%-75% success rate when applied correctly with proper risk management.
The more you study price behavior, the more reliable these patterns become as the market repeats itself in cycles.
By staying focused on price movement alone, you eliminate distractions from other indicators and get a clearer, more direct view of market trends. Combining this with statistical probabilities and the insights from volume and candlestick formations will give you a more refined approach to predicting price action.
Benefits of Price Action Trading
In the world of crypto trading, price action trading has gained significant traction due to its simplicity, effectiveness, and adaptability. Let’s dive deeper into why more traders choose price action to guide their decisions.
1. Simplicity
Price action trading stands out for its simplicity compared to complex systems involving multiple indicators. Research shows that 70% of traders focusing on price action report a clearer understanding of the market than those relying on complex indicators. This is because price action doesn’t overwhelm you with extra tools and allows you to focus solely on price movements-the core element of every market. By eliminating unnecessary clutter, price action makes it easier to spot key market signals.
2. Flexibility
The flexibility of price action trading allows it to be effective across different timeframes and markets. Price action adapts to both, whether you’re trading in the short-term or looking for long-term trends. According to a study by Investopedia, 75% of traders who use price action report success across different market types-from forex to cryptocurrency and stocks. The ability to use the same strategy for day trading, scalping, or swing trading makes price action an invaluable tool for all types of traders.
3. Increased Clarity
Using price action helps you focus on price movement, which is often the most reliable indicator of market direction. When traders rely on price action, they report a 50% reduction in confusion about market trends compared to those using multiple indicators. 83% of successful traders say they rely on price action to identify support and resistance levels and to detect potential trend reversals. This increased clarity allows you to avoid being distracted by irrelevant data and focus on what truly matters.
4. More Informed Decisions
When you understand price action, you're not just following price movements-you’re also gaining insight into market psychology. Research suggests that traders who study price action see a 30% improvement in decision-making because they can anticipate market reactions based on real-time data. By understanding market sentiment, you’ll be better prepared to make well-informed decisions rather than reacting impulsively.
Here’s a table to visually represent the benefits of Price Action Trading:
This table highlights the impact of each benefit, making it easy to understand how price action trading can enhance your trading success.
Common Mistakes to Avoid in Price Action Trading
While price action trading offers numerous benefits, it’s essential to avoid some common mistakes that could hinder your success. Let’s explore these errors and how to stay on the right path.
1. Overcomplicating the Analysis
A common mistake among new traders is overcomplicating their analysis by focusing on too many patterns or drawing multiple support and resistance levels. Research by Moomoo suggests that traders concentrating on 3 to 5 key patterns are 35% more successful in spotting high-probability trades than those relying on a wider variety. Keeping it simple with a few essential patterns helps maintain clarity and reduces confusion, leading to better decision-making.
2. Ignoring Market Context
While identifying patterns is critical, it’s equally important to consider the market context. T4Trade research shows that 65% of traders who incorporate market updates into their analysis see higher profits. Price action alone isn’t enough; understanding the bigger picture by looking at factors like market sentiment, news, and overall trends ensures you’re not making decisions in a vacuum. Market context can help you gauge whether a support level will hold or break, providing better insight into potential price movements.
3. Letting Emotions Influence Decisions
One of traders' biggest mistakes is allowing emotions to drive their decisions, which often leads to poor outcomes. A study by Altfins found that 72% of traders who let emotions influence their trading decisions experience higher losses. Price action trading requires a disciplined approach to focus on the data, not fear or greed. By keeping emotions in check and sticking to your strategy, you’ll make more rational, data-driven decisions that improve your trading outcomes.
Final thoughts
Price Action Trading is a simple and powerful way to understand the market movement. By focusing on price action, you eliminate the need for complicated indicators and get clarity into market psychology. This works across all timeframes and markets and helps you make better decisions for more winning trades.
Master Price Action Trading and sharpen your trading edges. Ready to take your trading to the next level? Check out our expertly crafted chart setups on PriceSync and stay in sync with the market. By mastering price action, you’ll be able to trade more confidently.
What are you going to do today to start mastering Price Action Trading? Let’s get started and see where it takes you!