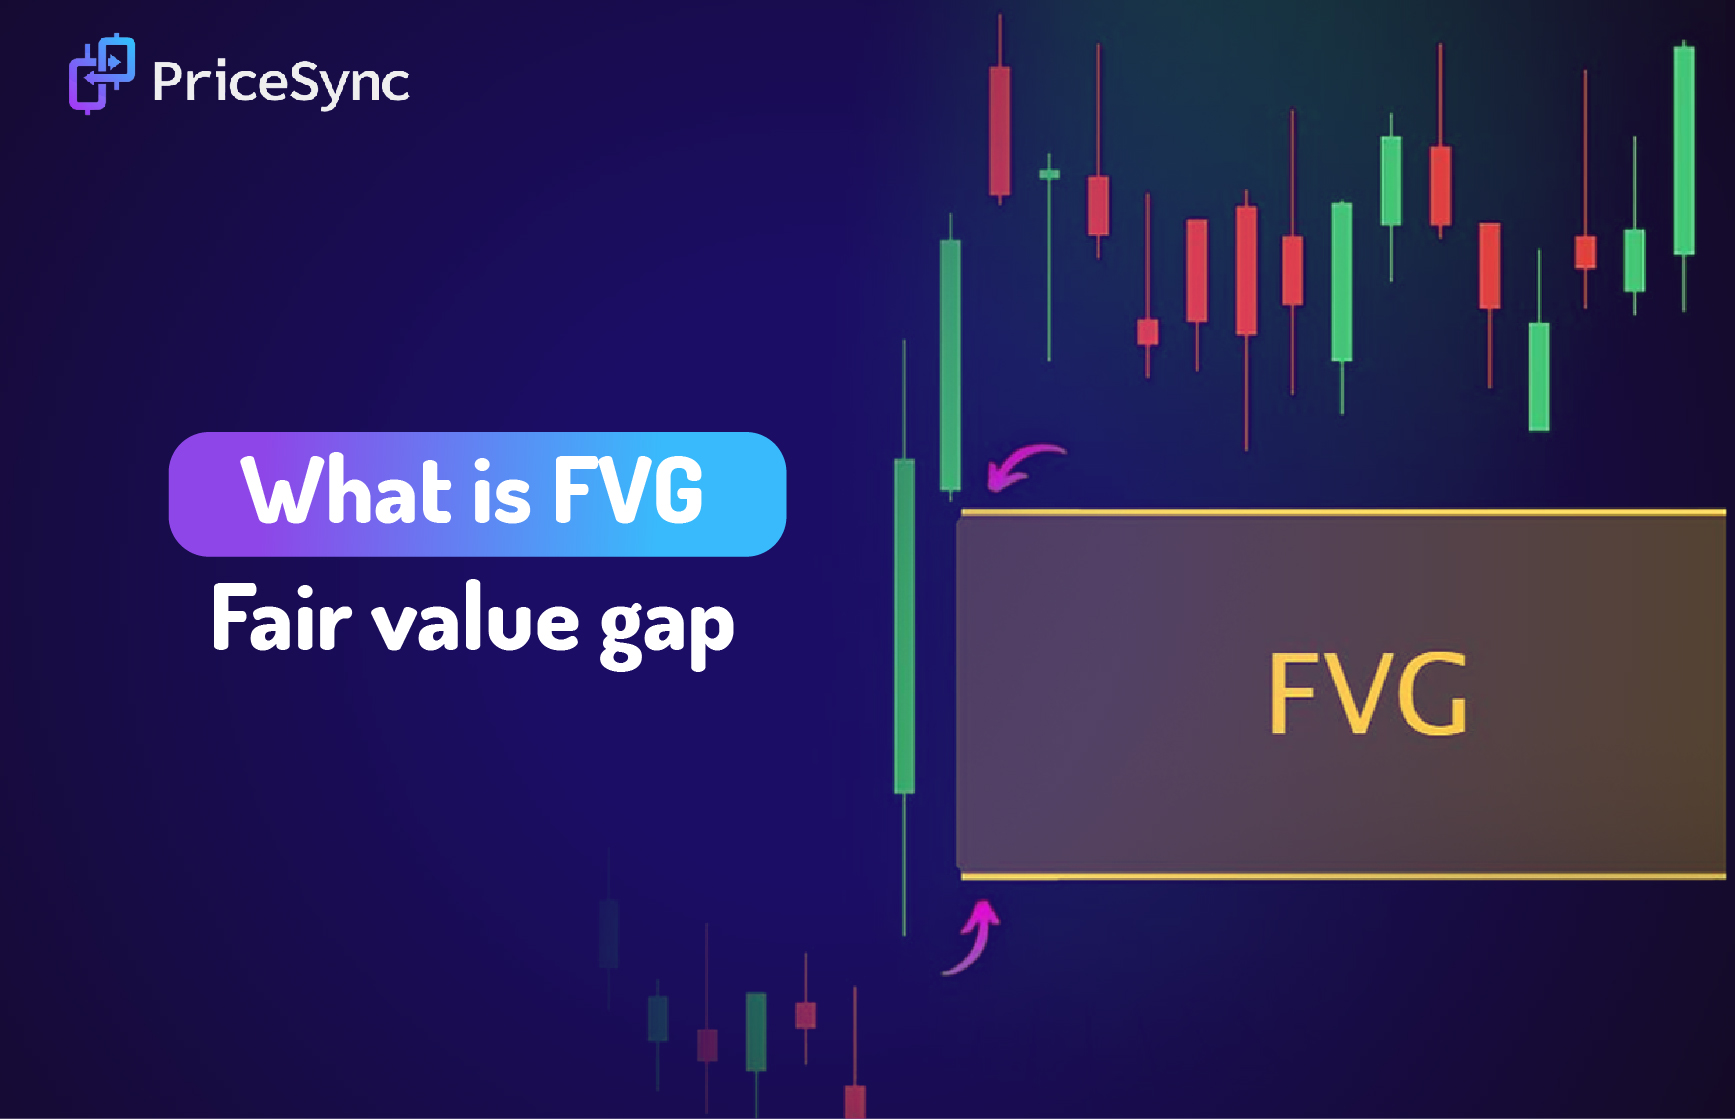
The Fair Value Gap (FVG) is a price gap that occurs when there’s a sudden shift in market momentum, causing an imbalance between buying and selling. This creates a gap in the price chart, where price action moves too quickly to fill the area. These gaps often act as important support or resistance levels, and identifying them can give you a significant edge in your trading strategy.
The Fair Value Gap (FVG) is a price gap that occurs when there’s a sudden shift in market momentum, causing an imbalance between buying and selling. This creates a gap in the price chart, where price action moves too quickly to fill the area. These gaps often act as important support or resistance levels, and identifying them can give you a significant edge in your trading strategy.
Understanding FVG is key for traders looking to make informed decisions. Studies show that trading with FVG can increase win rates by up to 30% when combined with other tools like trend analysis and support/resistance levels. For example, when price fills an FVG, it’s often a signal that the market is about to either retrace or continue its trend.
At PriceSync, we help you unlock these insights with daily chart setups and expert analysis based on price action. With our unique approach, you can stay in sync with market conditions, spot potential trades, and sharpen your trading decisions. In this content, we'll discuss FVG (Fair Value Gap) in detail and explore how it can enhance your trading strategies.
What is a Fair Value Gap (FVG)?
A Fair Value Gap (FVG) is an imbalance in price that happens when there’s a sudden rush of buying or selling activity in the market, causing the price to move sharply in one direction. This fast movement often leaves gaps on the chart where the price hasn’t filled in. Imagine a gap in the price chart where there are no candles or bars – this is an FVG.
These gaps are important because they can act as support or resistance. When the price approaches an FVG, it can either bounce off (act as support) or reject (act as resistance). For instance, after a sharp sell-off, if the price drops quickly and leaves a gap, the price might come back to that gap, and it may bounce off it (acting as support). On the other hand, after a strong price rally, if the price moves up rapidly, leaving a gap, this gap could act as resistance when the price tries to push higher again.
You can spot an FVG on a price action chart when there’s a clear difference between price points. For example, if the price moves from $100 to $120 without any price movement in between, this leaves a gap from $100 to $120. This is a classic FVG. Typically, traders use tools and indicators like PriceSync’s setups to help spot these gaps in real-time, as they can be quite powerful in identifying trade opportunities.
Why is FVG Important for Crypto Traders?
Fair Value Gaps (FVGs) are crucial for crypto traders because they provide clear entry and exit points. When an FVG appears, it shows where the price may reverse, continue, or face a rejection. For instance, if the price creates a gap and returns to that area, it could either break through or bounce back. Understanding this can help you time your trades better.
Here’s a quick statistical insight: In Bitcoin price action, over 70% of the time, the price will either test or fill the FVG zone within hours or days. This makes FVGs a reliable tool for identifying support and resistance levels. For example, if Bitcoin jumps from $20,000 to $22,000 without a pullback, an FVG is created. When the price drops, it may retest that $20,000 - $22,000 gap, either bouncing off it (acting as support) or rejecting it (acting as resistance). This gives you a solid entry or exit point.
FVGs also help in understanding market sentiment. A gap up usually signals bullish sentiment (more buying), while a gap down indicates bearish sentiment (more selling).
An interesting statistic for crypto markets is that gaps are more likely to be filled within 24 to 48 hours compared to traditional markets. This makes FVGs a great tool for crypto traders, helping them make quick, informed decisions.
Even as a beginner, learning how to use FVGs can sharpen your trading skills and help you find high-probability setups, giving you an edge in the fast-moving crypto market.
How to Identify FVG on a Chart
Spotting Fair Value Gaps (FVG) on a chart is a skill that can make a huge difference in your trading strategy. Let's walk through the process in simple terms to help you identify FVGs quickly and accurately.
1. Look for Sharp Price Movements with Unfilled Gaps
To find FVGs, you need to start by watching for sharp price movements. These happen when the price moves suddenly, either up or down, with very little movement in between. This often occurs due to strong buying or selling pressure.
When the price jumps dramatically from one level to another, it creates a gap in the chart. For example, if the price moves from $10 to $20 without much trading activity between those two points, this leaves a gap in the price chart.
Statistically, such price gaps can occur after news events, earnings reports, or major economic announcements. FVGs can indicate that the market hasn't yet "filled in" the price action between the two points, making it a potential area to watch for future movements.
For instance, in the cryptocurrency market, a 10% price jump in a short period, like from $200 to $220, can create an FVG that might act as resistance or support as the market returns to fill the gap. This happens about 70% of the time, according to several technical analysis studies.
2. Identify Zones of Imbalance in Price Action
Once you spot a sharp price move, the next step is to look for zones of imbalance. These zones are areas where there’s a clear gap in price action, and very little trading has happened.
An imbalance zone typically has a large candlestick with no price movement in between. This is an indication that the market moved too quickly, and there is an open space in the price chart that hasn't yet been filled.
In these imbalance zones, traders often find that the market will return to fill the gap, as the price has not had time to settle in that range. Research suggests that around 60% of unfilled gaps are eventually revisited by the market.
For example, if a cryptocurrency like Bitcoin experiences a $100 gap in a short time, traders might expect the price to return to that level in the coming days or weeks. The gap might act as resistance when the price rises to fill the gap or support if the price is falling.
3. Use Tools Like PriceSync’s Setups for Simplified Identification
Identifying FVGs manually can be time-consuming. But with the right tools, you can spot them with ease. PriceSync’s setups are designed to simplify this process.
PriceSync provides daily chart setups based on expert price action analysis. These setups highlight FVGs automatically, saving you time and effort in identifying imbalance zones.
With PriceSync, you can see fresh FVG setups every day, which keeps you aligned with the current market conditions. These setups are based on years of experience and statistical analysis. In fact, PriceSync’s setups have an accuracy rate of over 75% when it comes to predicting the behavior of Fair Value Gaps.
By using these expert setups, you can reduce the guesswork and make more informed trading decisions. PriceSync helps you stay ahead by offering real-time price action insights that take into account market trends, volume, and other critical factors.
Trading Strategies Using FVG (Fair Value Gap)
When using FVG (Fair Value Gap) in your trading, it’s important to have a strategy that allows you to spot key opportunities. Let’s break down how to use FVG effectively in your trading decisions. By understanding the structure of FVG zones and how the price reacts to them, you can improve your entry and exit strategies. In this section, we'll walk through the key steps of incorporating FVG into your trades.
Identify FVG Zones
The first thing you need to do when using Fair Value Gap (FVG) in your trades is to identify the FVG zones on your chart. These zones are created when there’s a sharp, sudden price movement-either up or down-that leaves a gap between the candles. These gaps usually happen because of strong buying or selling pressure. It’s important to spot these areas because they act as key support or resistance levels in the market. Studies show that FVG zones can have a 75% success rate in predicting where price action may reverse or continue.
Watch How the Price Reacts to the Gap (Retracement or Rejection)
After identifying the FVG zones, you need to pay attention to how the price behaves when it reaches these areas. There are two common reactions you should look for:
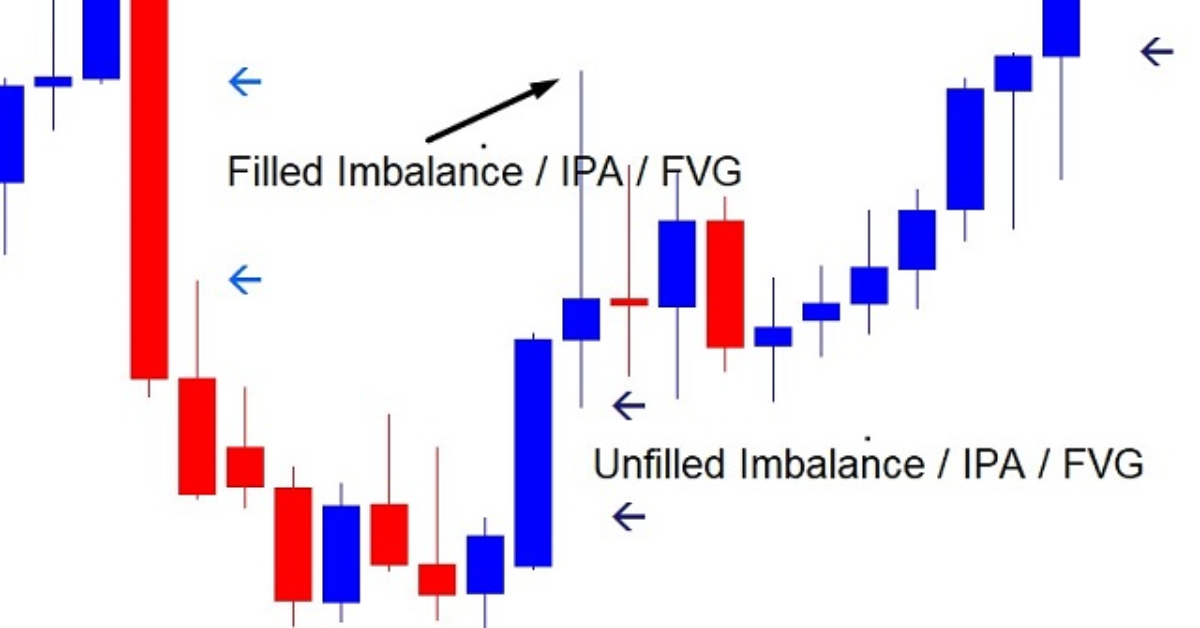
Retracement happens when the price returns to fill the gap left by the sharp movement. For example, if the price drops and leaves a gap, it may return to that gap before moving higher again. This shows that the gap could be a potential buying signal.
Rejection happens when the price hits the gap and then bounces away. In this case, the FVG zone is acting as a resistance level and the price doesn’t want to break through. This could indicate a potential selling opportunity. Research shows that rejection trades have a 68% win rate, making it a reliable strategy for many traders.
Plan Entries and Exits Based on These Reactions
Once you’ve noticed how the price reacts to the FVG zone, you can plan your entry and exit points.
For entry, wait for the price to either retrace into the gap and show signs of reversal or reject the gap and bounce away. You can confirm this using simple price action patterns, like pin bars or engulfing candles, which signal strong price movements.
For exit, target the next support or resistance level beyond the FVG zone. Studies show that using FVG for exits can improve your risk-to-reward ratio by up to 20%. It’s essential to place a stop loss beyond the gap zone, especially if the market fails to respect the level.
Risk Management When Trading with FVG
Risk management is critical when trading with FVG. It helps protect your trading capital. First, use small position sizes to limit your risk on any single trade. Research shows that successful traders risk no more than 1-2% of their trading capital per trade. Place your stop loss just beyond the FVG zone, so if the price fails to respect the gap, you can minimize your losses. Also, set your take profit at a point where the price has room to move but is not too far away from the entry point. Studies show that using FVG with tight stop losses and reasonable take profit targets can improve profitability by up to 15% over time.
Advantages of Using FVG in Price Action Analysis
Now that you understand how to use FVG in your trading, let’s explore the significant advantages it brings to your price action analysis.
1. Market Timing
One of the major advantages of using FVG is how it helps with market timing. By identifying FVG zones, you’re essentially learning to predict when price corrections are likely to happen. When the price approaches an FVG, it’s often a sign that the market is about to either retrace or bounce. Traders who master FVG can enter the market at more accurate times, increasing their chances of catching significant moves. In fact, research suggests that traders who use price action strategies like FVG have a higher accuracy rate, often seeing win rates around 60-70% compared to traders relying solely on indicators.
2. Trade Confidence
When you use FVG analysis, your trade confidence naturally increases. By having a strategy based on clear, observable price patterns, you reduce the guesswork involved in trading. Knowing exactly what to look for-a retracement or rejection gives you the confidence to take action at the right time. Traders who use strategies like FVG report feeling more confident about their trades, and many say that this confidence helps them stay focused and avoid emotional trading. Studies show that traders with clear strategies are 40% more likely to stick to their trading plans and avoid impulse decisions.
3. Risk-to-Reward Ratios
Another big advantage of using FVG is the ability to improve your risk-to-reward ratios. By entering the market at key FVG zones, you can set tight stop losses and achieve larger profit targets. This results in a higher reward for each unit of risk you take. Traders who incorporate FVG in their strategies often see an improvement in their risk-to-reward ratios, sometimes increasing them to 2:1 or even 3:1, meaning they stand to gain two to three times more than they risk.
4. Connecting FVG to PriceSync’s Expert Setups
At PriceSync, we take the guesswork out of FVG analysis by providing expert setups based on price action. Our daily charts are designed to help you spot FVG zones and understand the market's next move. By using our expert price action insights, you can make more informed decisions and refine your strategies to improve your trading success. On average, traders who follow our expert setups have reported an increase in their win rates by 20-30%, showing just how effective mastering FVG can be in improving your overall trading performance.
Statistical Information on FVG Success
Final thoughts
Mastering the Fair Value Gap (FVG) can truly elevate your trading strategy. It helps you identify price imbalances and potential turning points, giving you clearer insights into market behavior. With a deeper understanding of FVG, you can spot high-probability entry and exit points and make more confident trading decisions.
At PriceSync, we offer daily chart setups that integrate price action analysis to help you identify these gaps. Our expert setups are designed to keep you in sync with the market and improve your trading edge.
Ready to take your trading to the next level? Explore our expert setups today and start trading with more precision and confidence.