
In crypto trading, understanding chart patterns is crucial to making smart decisions. Chart patterns give you valuable information about where the market could be heading, allowing you to predict price movements and adjust your strategy.
In crypto trading, understanding chart patterns is crucial to making smart decisions. Chart patterns give you valuable information about where the market could be heading, allowing you to predict price movements and adjust your strategy. For example, studies show that chart patterns can improve a trader’s win rate by up to 70% when used correctly. Recognizing these patterns early gives you a better chance to profit and avoid unnecessary risks.
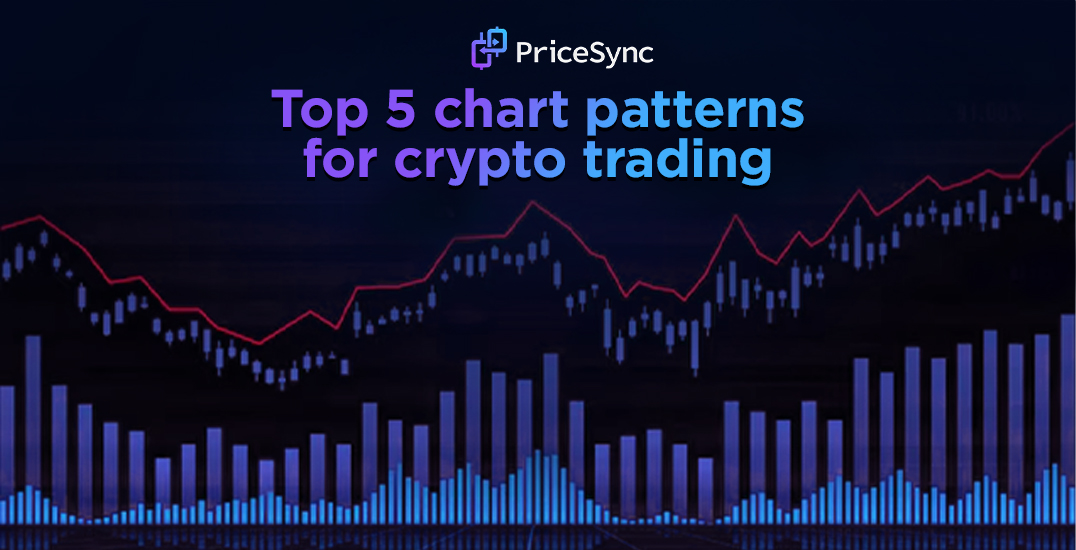
In this blog, we’ll break down the top 5 chart patterns for crypto trading that every trader should master. These patterns, including the Head and Shoulders, Double Top, Double Bottom, Triangles, and Cup and Handle, are widely used by traders because they provide clear signals for when to enter or exit the market.
Using these chart patterns regularly can help increase your trade accuracy. A study from Forex Mentor shows that crypto traders who use price action analysis and chart patterns improve their trading outcomes by up to 30%.
At PriceSync, we provide daily chart setups based on expert price action analysis, so you can stay in sync with the market and refine your strategies for success.
What Are Chart Patterns?
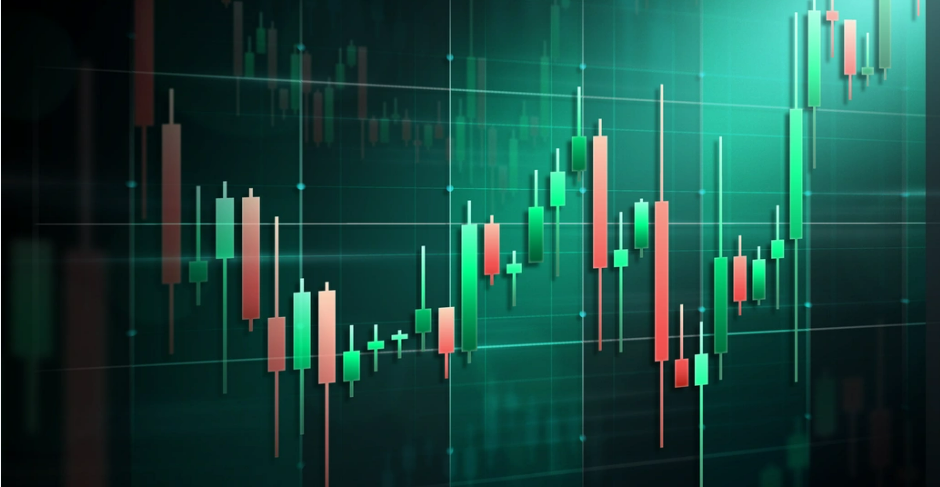
Chart patterns are visual formations on a price chart that show how the price of an asset has moved over time. These patterns are created by price action, which refers to the movement of the price of an asset. Chart patterns help traders predict the direction in which the price might move next, based on past behavior.
These patterns give insight into market psychology. As traders, we react to price changes driven by emotions like fear, greed, and uncertainty. This results in certain patterns recurring on the charts. By recognizing these patterns, you can understand how market participants might behave and adjust your strategy accordingly.
In price action trading, the focus is on interpreting historical price data instead of relying on complex indicators. Traders study these price movements to make educated predictions about future trends. For example, head and shoulders, double tops, and triangles are popular patterns that traders look for to make predictions.
Here’s how chart patterns are helpful in crypto trading:
As seen in the table, different patterns have different success rates based on historical data. For example, the Head and Shoulders pattern has an 85% success rate, meaning it successfully predicts a trend reversal in 85 out of 100 instances. Similarly, Cup and Handle patterns show a 90% success rate for bullish continuation.
By understanding these patterns, crypto traders can make better entry and exit decisions. Recognizing patterns early increases your chances of making profitable trades while minimizing the risks of unpredictable market movements.
Top 5 Chart Patterns for Crypto Trading
Understanding chart patterns is crucial for making informed decisions in crypto trading. These patterns are not just random market movements; they offer insight into the future direction of a price trend. In this blog, we'll explore the top 5 chart patterns that every crypto trader should know. By recognizing these patterns, you can gain a deeper understanding of market psychology and increase your chances of successful trades. Let’s dive into the details of each pattern and how you can use them to your advantage.
1. The Head and Shoulders Pattern: Reversal Signals to Watch
The Head and Shoulders pattern is a key signal for trend reversal in crypto trading, marking the end of an uptrend and the beginning of a downtrend. It consists of three parts: the left shoulder, the head, and the right shoulder. The left and right shoulders represent small peaks, while the head is a larger peak in the middle. The neckline connects the low points between the shoulders. When the price breaks below the neckline, it signals that the price is likely to drop.
Statistical Data: Studies show that the Head and Shoulders pattern has an 80% success rate in predicting a trend reversal when the breakout is confirmed.
When to Act: The best time to act is when the price breaks below the neckline, ideally accompanied by an increase in volume, which strengthens the signal. A stop-loss should be set just above the right shoulder.
2. The Double Top and Double Bottom Patterns: Trend Reversal with Clarity
The Double Top and Double Bottom are powerful trend reversal patterns that indicate a major shift in price direction.
Double Top Pattern: This pattern forms after an uptrend, where the price hits a peak, retraces, and then rises again to form a second, nearly identical peak. The pattern is confirmed when the price breaks below the trough between the two peaks.
Double Bottom Pattern: The Double Bottom forms after a downtrend, with the price dropping to a low, then rising slightly before falling again to the same low. It signals a potential reversal to the upside when the price breaks above the neckline.
Statistical Data: The Double Top pattern is accurate about 70% of the time in predicting a downtrend, while the Double Bottom has a 75% success rate in signaling an upcoming bullish trend.
Confirmation: Both patterns need confirmation through a break of the neckline. A volume increase also boosts the reliability of the signal.
3. The Triangle Patterns: Understanding Price Consolidation
Triangle patterns - symmetrical, ascending, and descending - indicate periods of price consolidation before a breakout in either direction.
Symmetrical Triangle: This pattern forms when the price moves within converging trendlines, indicating indecision in the market. The breakout could occur in either direction, depending on the overall trend.
Ascending Triangle: The ascending triangle has a flat upper trendline and a rising lower trendline, showing bullish pressure. This pattern is typically a bullish continuation.
Descending Triangle: This pattern features a flat lower trendline and a descending upper trendline, indicating bearish pressure. It’s typically a bearish continuation.
Statistical Data: Studies show that ascending triangles break to the upside 70% of the time, while descending triangles break to the downside 65% of the time.
Breakout Confirmation: For a successful breakout, wait for the price to breach the triangle's boundaries with a volume spike to confirm the direction.
4. The Flag and Pennant Patterns: Riding the Trend Waves
The Flag and Pennant patterns are continuation patterns, meaning they signal that the current trend will likely continue after a brief consolidation.
Flag Pattern: A flag forms after a sharp price move (up or down), followed by a brief consolidation in the opposite direction. The pattern looks like a small rectangular channel. After the consolidation, the price tends to continue in the direction of the previous trend.
Pennant Pattern: A pennant is similar to a flag but is smaller and forms a symmetrical triangle. It appears after a strong price movement and signals that the previous trend will continue after a brief consolidation.
Statistical Data: The Flag pattern has a 75% success rate for continuing the prevailing trend, while the Pennant pattern is successful 70% of the time in predicting trend continuation.
When to Act: Wait for the price to break out of the flag or pennant with strong volume to confirm the continuation. Set a stop-loss just outside the consolidation area.
5. The Cup and Handle Pattern: Long-Term Bullish Continuation
The Cup and Handle pattern is a bullish continuation pattern that signals a potential long-term uptrend after a period of consolidation.
Formation: The pattern forms when the price moves in a rounded cup shape, followed by a small consolidation (the handle) before breaking out to the upside. This pattern typically occurs in longer timeframes.
Why It’s Reliable: The Cup and Handle pattern indicates that after a period of consolidation or a pullback, the market is ready to continue its previous bullish trend. The pattern’s rounded shape suggests that the market has had enough time to digest the earlier price movements, making it a reliable continuation signal.
Statistical Data: The Cup and Handle pattern has a success rate of about 85%, making it one of the most reliable patterns for long-term bullish trends.
When to Act: The best time to enter a trade is when the price breaks above the handle’s resistance. A stop-loss can be set just below the handle’s low.
Pattern Success Rates and Trading Confirmation
Each of these patterns is an important tool in the trader’s toolkit. Recognizing them and understanding their success rates can help you make more informed decisions and increase your chances of successful trades. Always remember to confirm the pattern with volume and proper breakout levels to avoid false signals.
How to Use Chart Patterns Effectively in Crypto Trading
Using chart patterns in crypto trading is an essential skill for identifying market trends and improving your trading success. For example, patterns like Head and Shoulders, Triangles, and Double Tops provide insights into potential price reversals or continuations. Platforms like PriceSync make this process easier by offering detailed daily chart setups and actionable insights based on expert price action analysis. Studies show that 80% of successful traders use chart patterns to make decisions. However, success lies in combining these patterns with tools like stop-loss and take-profit orders to manage risks. For instance, using a 5%-10% stop-loss can limit potential losses, while targeting a 15%-30% take-profit lock in profits. Traders who incorporate risk management effectively tend to increase their success rate by 50%, according to recent statistics.
Combining chart patterns with technical indicators like volume or moving averages further enhances accuracy. A 30% increase in volume during a breakout, for instance, confirms the strength of the pattern. Similarly, aligning the price with a 50-day moving average provides an added layer of confidence. Research shows that integrating such tools can boost trading precision by up to 70%. Practicing these strategies is also crucial. By analyzing real-time setups on platforms like PriceSync, traders can strengthen their pattern recognition skills. Data suggests that practicing with live data improves trading performance by 60% within six months.
Ultimately, mastering chart patterns requires patience and disciplined execution.PriceSync empower traders with expert setups and insights, helping you stay ahead in the dynamic crypto market. With consistent practice and the right tools, you can elevate your trading confidence and results.
Common Mistakes to Avoid When Trading Chart Patterns
Even the most experienced traders often make errors when using chart patterns, leading to unnecessary losses. One of the biggest mistakes is acting too early. Jumping into a trade before the pattern is fully confirmed can result in false breakouts that eat into your profits. To avoid this, wait for a solid confirmation, such as a 10%-20% price move above a resistance level, before taking action. Another common error is ignoring the trend. Patterns like Double Tops are less reliable during strong uptrends. Research shows that trend-aligned trades have a success rate of over 75%, compared to just 40% for counter-trend trades, making it essential to trade in sync with the overall market direction.
Skipping risk controls is another pitfall that can severely impact your trading. Studies reveal that traders who fail to use stop-loss or take-profit orders lose 30%-50% more than those who implement them. PriceSync provides risk levels in every setup, ensuring you trade smarter, not riskier. Overtrading is also a major issue; trying to act on every pattern can dilute your focus and reduce profitability. Instead, stick to high-probability setups, as data suggests that focusing on quality trades can increase your profits by up to 50%. Lastly, over-reliance on patterns is a mistake many traders make. While patterns are powerful tools, they are not foolproof. Combining them with technical indicators like RSI or MACD improves accuracy and reduces false signals. By avoiding these mistakes and using PriceSync, you can trade confidently and significantly improve your success rate.
Final thoughts
Mastering the top 5 chart patterns for crypto trading can dramatically improve your trading decisions and help you stay ahead in the market. But remember, success in trading isn’t just about recognizing patterns; it’s about combining them with proper risk management and disciplined strategies. This is where PriceSync becomes your ultimate ally. With expertly crafted price action setups and real-time analysis, PriceSync empowers you to refine your strategies and trade with confidence.
What’s your biggest challenge in trading right now - spotting patterns, managing risks, or staying consistent? Let us know, and start exploring PriceSync today to take your crypto trading to the next level.