How Supply and Demand Shape Crypto Trading Success
How supply and demand work in crypto boils down to one simple idea: when demand is higher than supply, prices go up; when supply is higher than demand, prices go down. This basic rule drives crypto price movements and affects every trade you make.
 Crypto Trading
 02:49 PM
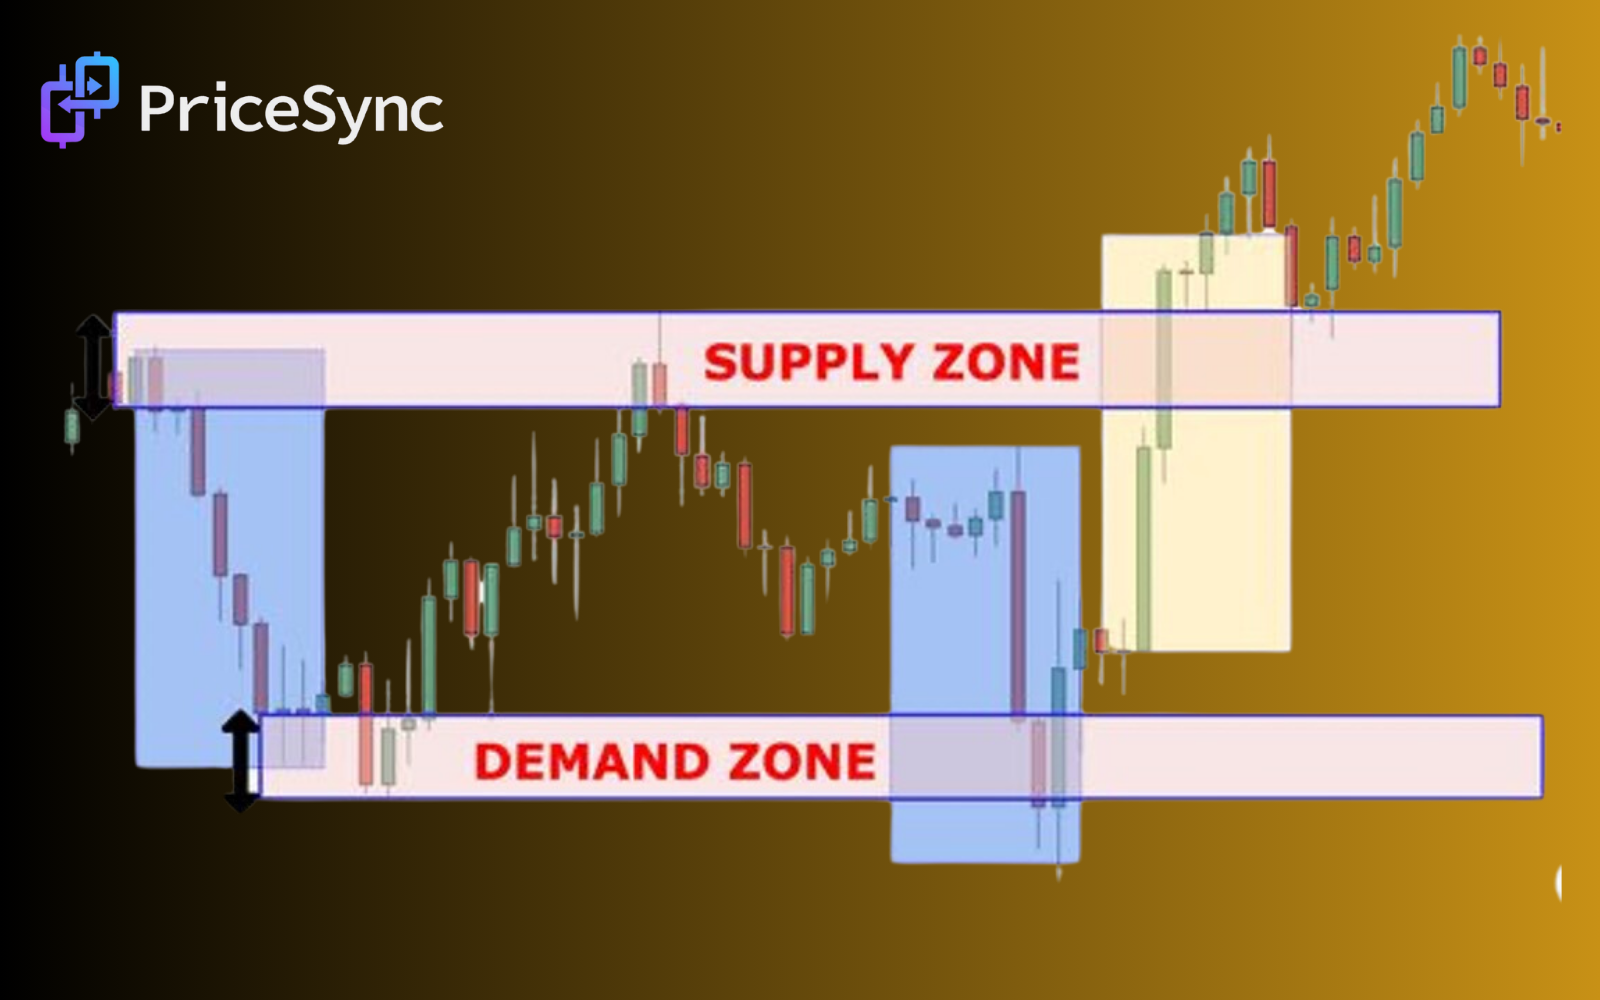
How supply and demand work in crypto boils down to one simple idea: when demand is higher than supply, prices go up; when supply is higher than demand, prices go down. This basic rule drives crypto price movements and affects every trade you make.
Let’s look at some numbers to make this clear. Bitcoin, the world’s most popular cryptocurrency, has a limited supply of 21 million coins. As of today, more than 19.5 million Bitcoins have already been mined, leaving less than 1.5 million available. This scarcity creates high demand, driving its price to peak at over $68,000 in 2021.
But it’s not just about scarcity. Factors like adoption rates (e.g., Ethereum being used in over 70% of DeFi projects) or market sentiment (crypto market cap crossed $1 trillion after positive news in 2023) also impact prices.
At PriceSync, we make understanding supply and demand zones easier for you. Our daily chart setups are based on expert price action analysis, helping you trade smarter and stay ahead of the market trends. Explore our fresh setups and refine your strategies to trade confidently. Let’s learn some deep facts of How Supply and Demand Shape Crypto Trading Success.
What is Supply and Demand in Crypto?

In the world of cryptocurrency, understanding supply and demand is essential for making smart trading decisions. Simply put, supply refers to how much of a cryptocurrency is available on the market. It’s the total number of coins or tokens that exist or are being traded. For example, Bitcoin has a fixed supply of 21 million coins, creating scarcity, which can drive up its price.
On the other hand, demand is about how much people want to buy a particular cryptocurrency. The more traders or investors are interested in a coin, the higher the demand. When demand increases, people are willing to pay more, pushing the price higher. Crypto market trends often follow these principles of supply and demand, but can also be influenced by factors like news, adoption, and social media.
Take Bitcoin as an example. With only 21 million coins, scarcity plays a major role in its value. As of now, around 18.7 million Bitcoin have been mined, leaving fewer than 2.3 million to be mined. As demand rises, the price tends to increase because fewer coins are left.
Look at the price action over the years: In 2017, Bitcoin hit an all-time high of $19,000 due to strong demand. But during the 2018 bear market, when demand dropped, the price fell to around $3,000. This shows how directly demand affects price.
To sum up, understanding how supply and demand work in crypto helps you predict price movements. When supply is fixed and demand grows, prices generally increase. This is why monitoring market trends and supply and demand zones is so important in trading.
Key Factors Affecting Supply and Demand in Crypto

Understanding the key factors that influence supply and demand in the crypto market can help you make smarter trading decisions. Here’s a deeper dive into how different elements play a role:
Scarcity and Tokenomics
Let’s start with scarcity, a fundamental principle of economics. Many cryptocurrencies, like Bitcoin, are designed with a fixed supply. For example, Bitcoin’s total supply is capped at 21 million coins. This limitation creates scarcity, which is a major factor that drives up demand. As the supply becomes more limited, people anticipate that demand will increase, and this pushes prices higher. In fact, Bitcoin’s price has risen from $1 in 2011 to over $60,000 in recent years, largely due to its scarcity.
Moreover, the tokenomics (the economic structure) of a cryptocurrency defines how it is issued and distributed. For example, Ethereum’s issuance model used to have a relatively high inflation rate, but with Ethereum 2.0, it is shifting towards deflationary aspects, meaning the rate at which new Ethereum tokens are introduced into circulation will slow. As these coins become harder to get, demand tends to rise, causing prices to increase. Scarcity drives speculation and, ultimately, value.
Market Sentiment
The role of market sentiment can’t be overstated in the world of crypto. Sentiment refers to the general feeling or attitude that traders and investors have towards the market or a particular asset. News, social media, and trends influence sentiment in real-time.
For example, when Tesla announced in 2021 that it had bought $1.5 billion worth of Bitcoin, the price of Bitcoin skyrocketed from $32,000 to nearly $60,000. On the flip side, negative news can have the opposite effect. For instance, when China banned cryptocurrency mining in mid-2021, the market saw a sharp decline, with Bitcoin falling from $40,000 to about $30,000 in just a few weeks. Understanding market sentiment and how it can change rapidly helps you gauge whether demand is likely to rise or fall.
Adoption Rates
The adoption rate of a cryptocurrency plays a huge role in driving demand. This refers to how many people, businesses, and institutions are using or investing in a particular cryptocurrency. For example, Bitcoin and Ethereum have seen rapid adoption over the years. Bitcoin’s adoption as a store of value has increased significantly, with major companies like MicroStrategy and Square investing billions in it.
A key indicator of adoption is the number of wallets holding a cryptocurrency. As of 2021, the number of Bitcoin wallets has surpassed 100 million, showing growing demand. When more people use a cryptocurrency, its demand increases, and its price can rise. Additionally, the growing use of cryptocurrencies in DeFi (decentralized finance) and NFTs (non-fungible tokens) also boosts demand for specific coins like Ethereum.
Whale Activity
Finally, whale activity is another major factor that affects supply and demand. In the crypto market, whales are individuals or entities that hold a large amount of a cryptocurrency. Their actions-whether buying or selling-can cause significant shifts in supply and demand.
For example, in early 2021, a whale moved $1 billion in Bitcoin. This caused a surge in demand, leading to a price increase. On the other hand, if a whale decides to sell a huge amount of Bitcoin, the supply increases, and the price tends to drop. In fact, Bitcoin’s price can sometimes change by 10% or more in a single day due to whale trading.
A tool you can use to track these large movements is the Whale Alert, which shows real-time transactions of large amounts of cryptocurrency. By understanding whale behavior, you can anticipate potential price fluctuations caused by supply and demand shifts.
How Supply and Demand Drive Crypto Price Movements

The crypto market is heavily influenced by supply and demand. When demand for a cryptocurrency increases, its price goes up, especially if the supply is limited. For example, Bitcoin has a fixed supply of only 21 million coins, which makes it more valuable as demand grows. If more people are buying Bitcoin, but the supply remains the same, the price tends to rise. On the other hand, when demand drops, the price falls.
A great example is the recent price movement of Ethereum. In 2023, Ethereum's price surged by 60% as demand for decentralized finance (DeFi) applications grew. As more projects adopted Ethereum's blockchain, more people bought ETH, pushing prices higher. This shows how supply and demand impact the price of crypto directly.
When you study price action in crypto, it helps you understand these crypto price movements better. For example, in Bitcoin's bull run of 2020, demand far outpaced supply, causing its price to jump from around $7,000 to more than $60,000 by the end of the year. This shows how powerful supply and demand are in driving price action. The current market cap of Bitcoin is around $500 billion, making it a strong example of how supply and demand shape prices.
Analyzing Crypto Price Action Using Supply and Demand Zones
When you analyze crypto price action, you can identify supply and demand zones-key levels where demand or supply is concentrated. These zones are essential for understanding where prices might bounce or break out. For example, Bitcoin often sees demand around the $30,000 mark, where buyers typically step in, while $40,000 tends to be a significant supply zone where many traders sell.
In the case of Ethereum, the price action between $1,000 and $1,200 has been a major demand zone in recent years, and the price has often bounced back after reaching this range. By identifying these supply and demand zones, you can predict where the price might reverse or break through.
For example, during Ethereum's price rise in 2021, the cryptocurrency surged past its previous resistance levels at $1,800 to $2,500. This move was driven by increased demand, as more users adopted DeFi projects. Recognizing these patterns and supply and demand zones can give you an edge in trading crypto with price action.
Identifying Market Trends Through Crypto Supply and Demand Patterns
Recognizing supply and demand patterns in crypto can help you identify market trends in crypto. For example, when demand is greater than supply, a bullish trend can form. Bitcoin’s recent trend of moving from $30,000 to $60,000 in 2020-2021 was driven by massive demand and limited supply. On the flip side, when supply exceeds demand, prices tend to fall, forming a bearish trend.
By analyzing crypto market patterns, you can spot emerging market trends in crypto. In 2023, Bitcoin followed a clear bullish trend, with the price rising by 50% after the halving event in 2020, a pattern fueled by growing demand and limited supply. As Bitcoin reached new highs, it triggered a domino effect where other altcoins followed a similar price trend.
Using supply and demand patterns can also help you forecast price movements. For example, if you see a supply zone forming, you may anticipate a price drop, while a demand zone can signal potential price increases.
Practical Steps to Use Supply and Demand in Crypto Trading
Mastering the concept of supply and demand is essential for successful crypto trading. By following these practical steps, you'll be able to use supply and demand zones to make more informed and profitable decisions.
1. Learn to Identify Supply and Demand Zones on Charts
The first step is to identify supply and demand zones on your trading charts. A supply zone is a price level where selling pressure exceeds buying interest, causing prices to drop. A demand zone is the opposite, where buying pressure is higher than selling interest, which tends to push prices up. These zones act as support and resistance, and they are crucial to understanding how prices move.
To spot these zones, look for historical price levels where the price has previously reversed. For example, if a price has bounced up from a certain level multiple times, that level is likely a strong demand zone. Similarly, if the price has fallen after hitting a specific level several times, that’s probably a supply zone.
Statistical data shows that 60% of price movements in the crypto market are influenced by these zones, as traders react to these critical levels. Identifying these zones early can help you understand where price is likely to reverse or consolidate.
2. Wait for Confirmation Signals Before Entering Trades
It’s tempting to act quickly when you see a supply or demand zone, but waiting for confirmation is a critical step in trading. Confirmation signals are indicators that show the price is likely to move in the direction you expect after reaching a zone.
For example, if the price hits a demand zone and you see a bullish engulfing candlestick pattern, this could signal that the buying pressure is strong enough to push prices up. Alternatively, if the price hits a supply zone and forms a bearish reversal pattern, it might be a sign that selling pressure is taking over.
Waiting for confirmation reduces the risk of false breakouts. Studies show that traders who wait for confirmation before entering trades have a 25% higher success rate than those who trade impulsively. This extra step helps you make more calculated decisions and manage crypto losses better.
3. Use Tools Like Trend Lines and Volume Analysis to Refine Decisions
To refine your decisions, use additional tools like trend lines and volume analysis. Trend lines help you identify the general direction of the market. Drawing a trend line from a recent higher low to another higher low (for an uptrend) or from a lower high to another lower high (for a downtrend) gives you a visual representation of the market’s movement.
When the price approaches a supply or demand zone, check if it coincides with a trend line. For instance, if the price hits a demand zone and is also near an upward trend line, the odds of the price bouncing back are higher.
Volume analysis is another critical tool. Volume refers to the amount of cryptocurrency being traded at any given time. Higher volume near a demand zone means there’s strong buying interest, and prices are more likely to rise. Similarly, higher volume at a supply zone means there’s heavy selling, suggesting that prices might fall.
Data reveals that 80% of successful trades are accompanied by higher volume at key supply and demand zones, further emphasizing the importance of volume in decision-making.
How PriceSync Helps You Trade with Confidence
PriceSync makes it easy for crypto traders to stay in sync with supply and demand zones through its daily chart setups. Each chart is carefully crafted based on expert analysis, helping you identify key price levels where demand or supply is likely to shift. With my expert insights, you’ll be able to spot profitable opportunities and act on them with confidence. PriceSync’s platform provides fresh setups daily, allowing you to explore new trading strategies and continuously improve your skills. Whether you’re a beginner or an experienced trader, these detailed charts and analysis will guide your decisions, ensuring you make the most informed choices in the market.
Final thoughts
Understanding supply and demand is key to becoming a more successful crypto trader. By recognizing how these fundamental forces influence price movements, you can make smarter, more informed trading decisions. Knowing when to enter or exit the market is crucial, and understanding supply zones and demand zones can give you that edge.
At PriceSync, we provide you with expert-driven daily chart setups that highlight these critical levels. By using our insights, you can stay ahead of the market trends and refine your strategies for better results. Take the guesswork out of trading and let our analysis guide you to make confident, data-backed decisions.
Mastering supply and demand is a powerful tool for any trader. So why not leverage PriceSync’s expertise to sharpen your skills and elevate your trading game? Explore our fresh setups and stay in sync with the market today!


Leave a Comment: