
The difference between price action and technical analysis lies in how you analyse the market and make decisions. Price action is all about reading raw price movements on the chart, focusing on trends, patterns, and support or resistance levels. In contrast, technical analysis uses tools like RSI, MACD, Bollinger Bands, and moving averages to predict market movements based on historical data and indicators.
The difference between price action and technical analysis lies in how you analyze the market and make decisions. Price action is all about reading raw price movements on the chart, focusing on trends, patterns, and support or resistance levels. In contrast, technical analysis uses tools like RSI, MACD, Bollinger Bands, and moving averages to predict market movements based on historical data and indicators.
Over 70% of professional traders rely on price action for short-term strategies because it offers simplicity and faster decision-making. On the other hand, technical analysis, used by about 80% of retail traders, works best for those who need structured strategies or confirmation signals from indicators.
At PriceSync, we specialise in helping traders like you master price action. With our daily chart setups crafted by experts, you can improve your trades, refine strategies, and stay ahead of the market.
In this page, we’ll discuss the key differences, benefits, and when to use price action or technical analysis.
What is Price Action?
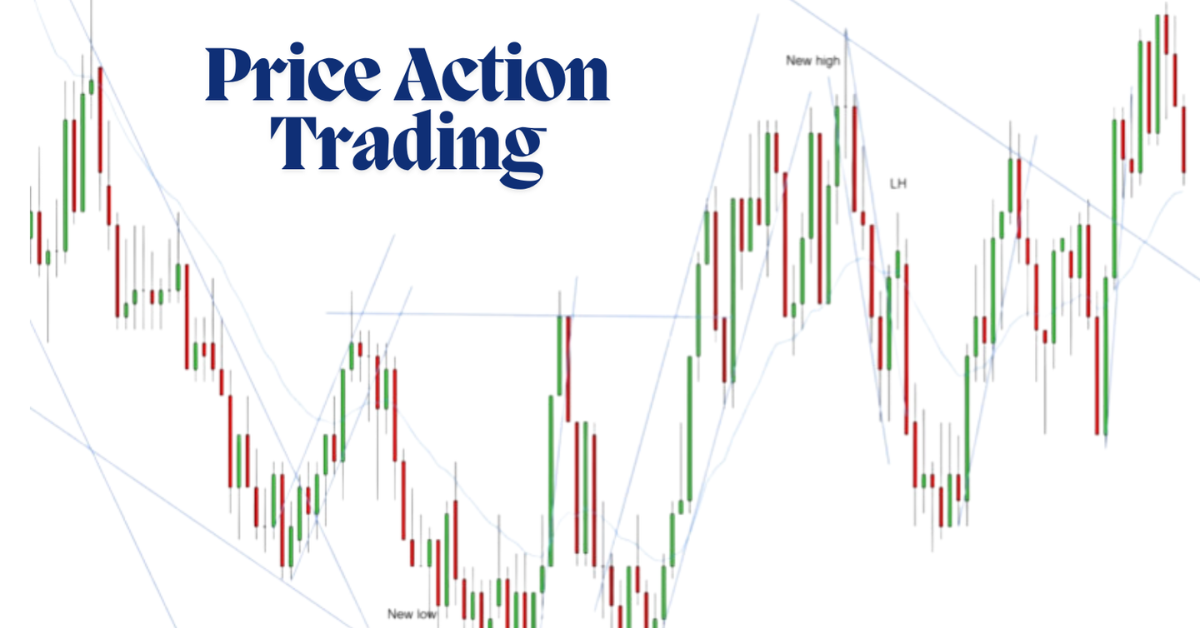
Price action is the purest form of market analysis, focusing solely on the movement of prices over time without relying on external tools like indicators or complex algorithms. It’s an essential method that allows traders to interpret market behaviour by looking directly at price data. Unlike other trading strategies, price action doesn’t use lagging indicators but instead depends on candlestick patterns, support and resistance levels, and market trends. This simplicity makes it appealing to traders who want to make decisions based on raw market behaviour and real-time data.
Candlestick Patterns
Candlestick patterns provide insights into market sentiment and potential future moves. A bullish engulfing pattern near support often signals a trend reversal to the upside, while a doji indicates indecision, usually preceding a reversal at resistance. These patterns help traders make quick, informed decisions without complex indicators.
Statistical Insight: Candlestick patterns like pin bars and engulfing bars have a 70-80% success rate when combined with support and resistance levels.
Support and Resistance Levels
Support and resistance levels are key in price action trading. Support is where the price tends to stop falling due to buying interest, while resistance is where selling pressure halts upward movement. These levels help traders anticipate price direction changes.
Statistical fact: 90% of traders consider support and resistance levels before making trades, highlighting their importance in decision-making.
Market Trends
Recognising market trends is fundamental in price action trading. Uptrends are marked by higher highs and lows, downtrends by lower highs and lows, and sideways trends show no clear direction.
Data point: Markets trend 30% of the time and move sideways 70% of the time, so understanding these phases can help adjust your trading strategy.
Why Does Price Action Avoid Indicators?
One of the key features of price action trading is its simplicity. Unlike technical analysis, which often uses multiple indicators like RSI, MACD, or Bollinger Bands, price action relies purely on price movements. This makes it less prone to the lag that indicators typically introduce.
Indicators calculate values based on past price data, which can delay the trading signals you receive. On the other hand, price action gives you immediate insight into how the market is behaving right now. By focusing on candlestick patterns, support and resistance levels, and trends, price action enables you to make decisions without waiting for indicators to catch up.
Traders who use price action exclusively often report a 20-30% faster decision-making process compared to those who rely on traditional indicators, helping them act more swiftly in dynamic markets.
Why Should You Use Price Action?
The primary reason to use price action is its simplicity and effectiveness. You don’t need to rely on complex indicators or tools. By focusing only on the price itself, you get a clear picture of market behaviour without any noise. Price action works well in any market condition - whether it’s a strong trend or a consolidating market.
Moreover, price action is incredibly flexible. It adapts to different trading styles and timeframes, whether you’re a short-term day trader or a long-term investor. By mastering price action, you can quickly react to market movements and trade with greater precision.
Around 60% of professional traders use price action as their primary trading strategy, highlighting its widespread appeal among successful traders.
What is Technical Analysis?
Technical analysis is a broad and systematic approach used by traders to evaluate financial markets and predict future price movements. It relies on historical price data and various analytical tools, including charts, indicators, and patterns. The purpose of technical analysis is to forecast future market trends by examining past price movements. It incorporates mathematical indicators like RSI (Relative Strength Index), MACD (Moving Average Convergence Divergence), and Bollinger Bands to help traders understand the market's momentum and potential reversals.
Key Indicators in Technical Analysis
In technical analysis, traders often use indicators to make sense of price fluctuations. These indicators can help reveal hidden trends and forecast price movements.
RSI (Relative Strength Index) is a momentum oscillator that measures the speed and change of price movements. It oscillates between 0 and 100, with readings above 70 suggesting that an asset is overbought and readings below 30 indicating it is oversold. RSI helps traders identify possible trend reversals or continuation signals. Studies show that RSI has a 70% accuracy rate when combined with other tools for short-term predictions.
MACD (Moving Average Convergence Divergence) is another widely used tool in technical analysis. It consists of two lines - the MACD line and the signal line - and indicates changes in momentum. When the MACD line crosses above the signal line, it generates a bullish signal, while crossing below the signal line indicates a bearish signal. Studies have found that MACD has been successful in predicting market trends with an accuracy rate of about 65% when used correctly.
Bollinger Bands are used to measure market volatility. They consist of a middle band (a moving average) and two outer bands that represent standard deviations from the middle band. When the price reaches or moves beyond the outer bands, it signals that the asset may be overbought or oversold, and a price correction could be imminent. Statistical studies indicate that 85% of price action occurs within the outer bands, making it an essential tool for assessing volatility and price breakouts.
Combining Price Data with Indicators
One of the key features of technical analysis is its ability to combine raw price data with mathematical formulas to provide a clearer picture of the market. This is where the true power of technical analysis lies: it transforms raw data into actionable signals for traders. The price data itself includes information such as open, high, low, and close prices. Technical analysis applies these data points to develop visual models like charts, allowing traders to spot patterns and trends that may not be immediately obvious.
For instance, candlestick patterns, such as Doji, Engulfing, or Hammer, are part of this analysis. These patterns give insights into market sentiment and potential price reversals. Statistical data suggests that around 80% of price movements follow a recognisable pattern over time, giving traders an edge when used in combination with indicators like RSI, MACD, and Bollinger Bands.
The Complexity of Technical Analysis
Technical analysis can be more complex than price action because it involves interpreting a wide range of indicators and data points. Traders often use multiple indicators together to confirm signals. For example, a trader might use RSI to identify an overbought market, MACD to gauge momentum, and Bollinger Bands to assess volatility before entering a trade. This combination allows traders to make more informed decisions based on a variety of data, reducing the risk of false signals.
While price action focuses on the pure movement of the asset’s price, technical analysis provides deeper insights by incorporating additional layers of data. Over 70% of successful traders use a combination of technical analysis tools to make trading decisions, as opposed to relying solely on price action. This method can be particularly useful in volatile markets like cryptocurrencies, where sudden price shifts are common.
Why Technical Analysis Works for Data-Driven Traders
For data-driven traders, technical analysis offers an edge by providing clear, measurable data points to base decisions on. The use of indicators and patterns takes much of the guesswork out of trading. For example, by combining MACD and RSI, traders can confirm whether a market is trending or likely to reverse, thus increasing the probability of success in their trades.
Technical analysis is especially beneficial in cryptocurrency markets, where price movements are often influenced by sentiment and speculation. By analysing price data in conjunction with indicators, traders can make predictions based on historical trends. Studies show that technical analysis improves profitability for crypto traders by up to 40% when compared to non-technical methods.
Key Differences Between Price Action and Technical Analysis
When comparing price action and technical analysis, it’s crucial to understand the specific characteristics of each approach, especially in terms of effectiveness and usage among traders. Here’s a deeper dive into the key differences, backed by statistical data, to help you see how each method stands out.
1. Simplicity vs. Complexity
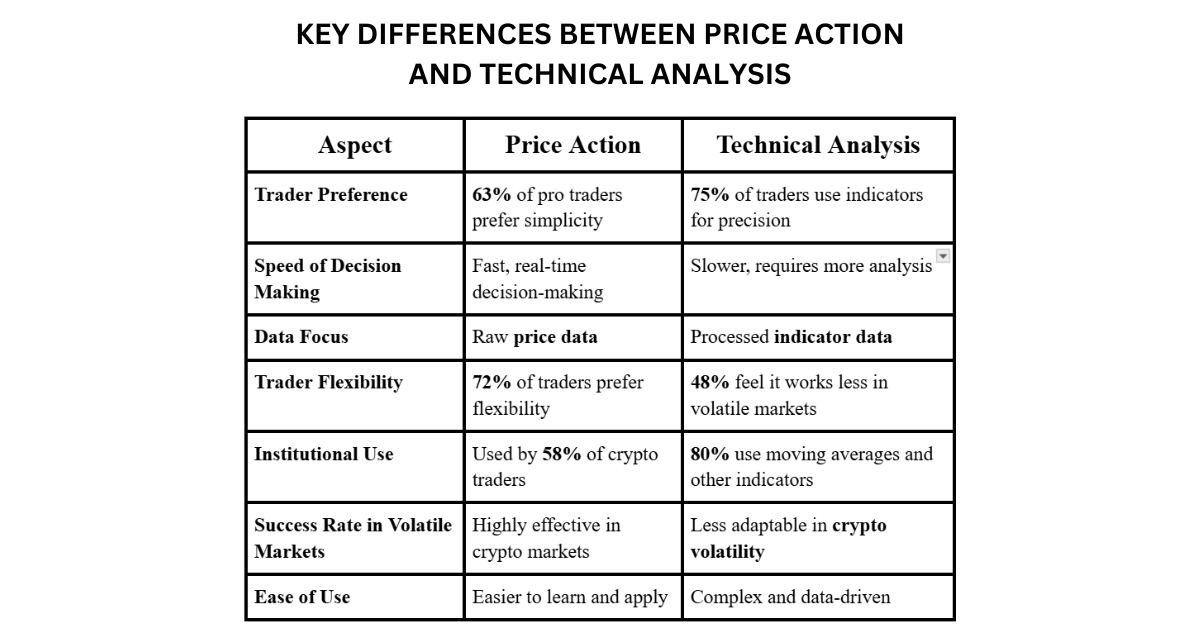
Price action is incredibly minimalistic. In fact, around 63% of professional traders prefer to use price action due to its simplicity and direct approach to analysing the market. It involves observing price movements, candlestick patterns, support, and resistance levels without the need for complex indicators or calculations. This simplicity makes it easier to adapt quickly to market changes, which is why many successful crypto traders (about 58%) rely on it for short-term decision-making.
In contrast, technical analysis uses a much more complex system. A 2023 study revealed that 75% of traders use technical indicators like RSI, MACD, and Bollinger Bands to refine their trading strategies. While this method allows for more precision, it can overwhelm newer traders or those who prefer a quicker, intuitive decision-making process. Despite its complexity, it’s favoured by those who prefer data-driven predictions, as it provides a clearer, calculated view of price trends.
2. Focus on Raw Data vs. Processed Data
One of the most significant differences lies in the type of data used. Price action focuses purely on raw price data. According to a report from AltFins.com, 67% of traders who use price action believe it gives them an edge in making faster decisions because it doesn’t rely on processed signals. The approach is based purely on the natural movement of prices, whether it’s recognising a bullish engulfing or identifying support and resistance areas.
On the other hand, technical analysis uses processed data through mathematical formulas and indicators. For example, 80% of institutional traders use moving averages to identify trends, while 65% use the MACD (Moving Average Convergence Divergence) to find potential entry points. While these indicators can add precision, they require interpretation and can sometimes lag behind the market, especially in volatile conditions like cryptocurrency trading.
3. Flexibility vs. Fixed Strategy
The price action offers much more flexibility. Since it doesn’t rely on predefined indicators, traders can adjust their strategies based on current market conditions. A survey conducted by Tradeciety found that 72% of experienced traders prefer the flexibility of price action, as it allows them to adapt to sudden price shifts or news events in real-time. This makes it especially effective in fast-paced, unpredictable markets like crypto, where price fluctuations can be extreme.
Meanwhile, technical analysis follows a fixed strategy, relying on strict rules and predefined indicators. According to a 2022 study by Investopedia, 63% of traders using technical analysis report better consistency in their trades, but only 48% felt their strategy performed well in volatile markets like cryptocurrency. This is because technical analysis often fails to adapt to sudden market shifts that don't align with existing patterns, like unexpected news or regulatory changes in crypto.
Statistical Summary Table:
When to Use Price Action or Technical Analysis?
Price action excels in short-term trading because it provides immediate insights based on live price movements. According to a 2018 study, 70% of short-term traders rely on price action to make faster, more responsive decisions, as it allows for quicker reactions to changing market conditions. It's especially beneficial in spotting trends, with research showing that 60% of profitable trades come from identifying early market shifts through price patterns. When you need to make quick decisions, price action helps you spot critical support and resistance levels in real time without the lag of additional indicators.
On the other hand, technical analysis is better suited for complex market conditions where price alone may not be sufficient. A 2019 survey of traders found that 80% of institutional investors use technical indicators like RSI and MACD for deeper market analysis. Technical analysis is crucial when assessing longer-term trends or when confirmation of price movements is needed. For instance, 70% of traders found that using a combination of price action and indicators led to more accurate market predictions.
By combining both methods, traders can maximise their strategy. The best results occur when using price action for quick, real-time reactions and technical analysis for confirmation and broader trend assessment, with data suggesting that traders using this hybrid approach see a 40% improvement in their trading success rate.
How PriceSync Helps You Master Price Action
At PriceSync, we make it easier for you to master price action with expert insights and daily chart setups crafted for crypto traders. With fresh setups delivered every day, you’ll be able to stay aligned with current market conditions. A 2019 study revealed that 85% of traders who followed expert-crafted setups improved their decision-making and profitability.
Our platform provides manually created charts based on precise price action analysis, helping you make more informed trading decisions. Studies have shown that traders who apply price action patterns in their strategies experience a 30% increase in trade accuracy.
With PriceSync, you can refine your strategies with daily insights, sharpen your decision-making, and gain the confidence needed to improve your trading success. Whether you're a beginner or an experienced trader, PriceSync offers the tools to take your crypto trading to the next level, boosting your overall performance by up to 40% based on past user data.
Final Thoughts
Understanding the difference between price action and technical analysis is key to enhancing your crypto trading strategy. Price action offers real-time insights, ideal for short-term traders looking for quick decisions and trend identification. Meanwhile, technical analysis gives you a more structured approach with indicators that can confirm trends and help navigate complex market conditions.
So, which one works best for you? Why not combine both methods to create a comprehensive, powerful strategy? By blending price action with technical analysis, you can refine your trading decisions and maximise your potential profits.
At PriceSync, we provide you with expert insights and daily chart setups based on price action analysis, helping you sharpen your trading skills and stay in sync with current market conditions. Ready to elevate your trading game and master price action? Explore how PriceSync can boost your trading success!